From a snapshot to an audit trail
- Company
- Updater
- Role
- Designer, sole on the surface
- Scope
- Analytics in Updater Pro
- Users
- Internal operations teams and PMC admins
- Year
- 2026
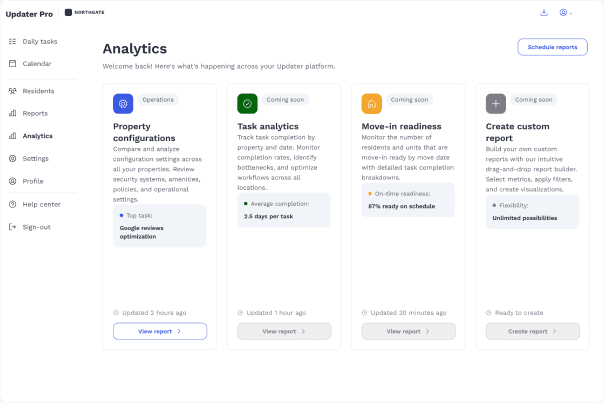
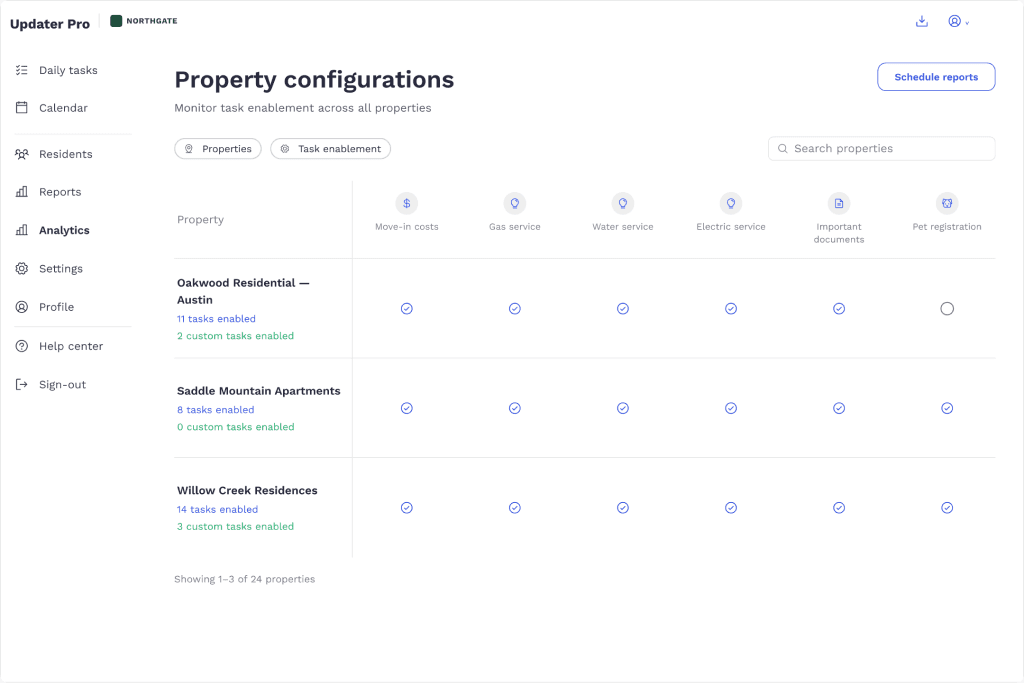
Updater Pro had an analytics tab. It showed which tasks were configured at each property, it worked, and almost nobody used it. Month over month, under 1% of users clicked into it. The reason was not discoverability. The report answered what is configured, and the job people actually had was to prove the configuration was correct.
Two decisions that shaped it
Ship the one report that was ready
Four reports were scoped and one had the data behind it. Holding the page until all four existed meant another quarter of manual audits. I shipped the live report beside three Coming soon cards with disabled CTAs and a line of description each, behind a feature flag. The page tells you what it is rather than pretending to be finished, and it gave the teams doing audits something usable a quarter earlier.
Deciding what the customer may not see
The same report serves Updater internal teams and, eventually, the property managers themselves. Some configuration data is tied to Updater revenue. Showing a partner everything exposes commercial settings that are not theirs to see; showing them nothing means the report only ever serves internal staff. I split visibility by role rather than by report, so sensitive fields are permission-gated inside one surface instead of forcing two separate products to be maintained.
What happened
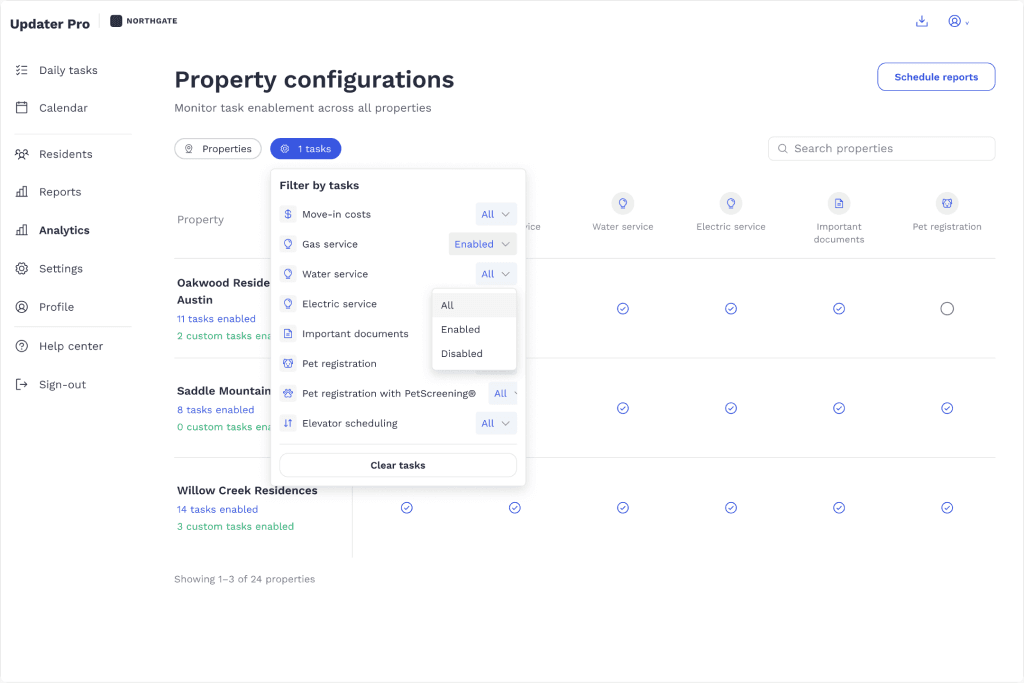
Phase 1 is live behind a flag with one working report. Phase 2, the property drill-in carrying full task-level configuration and CSV export, is in build. The design work that mattered was not the dashboard. It was realising the export button is the product for anyone running an audit, and the dashboard is how they get to it.
How I worked
Every state from the source
Skeleton, both empty messages, the disabled Coming soon treatment, and the horizontal scroll behaviour on an eighteen-column matrix. Documented from the built product rather than the happy path.
One component layer
Built entirely from live Polaris instances, so the spec and the build share components instead of drifting apart after handoff.
Validation before exposure
Internal usability sessions with Implementation, Partner Success, Operations and Support scheduled before any property-manager access, because the permissioning question has to be settled first.
What I would change
Under 1% is not a discoverability problem. The first version was not under-designed, it was aimed at the wrong question. I would have started by asking what someone does the day after they open a report rather than what they would want to see on it. Phase 2 exists because the export matters more than the dashboard, and a week sitting with an Implementation specialist would have surfaced that before anything was built.